In this Linux tutorial, you will learn how to install Grafana on Linux 9 that includes all Red Hat based Linux distributions. #centlinux #linux #grafana
Table of Contents
What is Grafana?:
Grafana is an open-source data visualization and monitoring tool used for analyzing and monitoring time-series data. It provides a rich set of features and a flexible and customizable platform for creating interactive dashboards and graphs. Grafana supports a wide range of data sources, including popular databases like MySQL, PostgreSQL, and Prometheus, as well as cloud services like AWS CloudWatch and Google Analytics.
With Grafana, you can connect to various data sources, query the data, and create visually appealing and informative dashboards. It offers a web-based interface that allows users to build and configure their dashboards using a drag-and-drop approach. You can add different panels to a dashboard, such as graphs, tables, or gauges, and customize them with various visualization options and settings.
Grafana also supports alerting and notification features, allowing you to set up alerts based on defined thresholds or conditions. When a threshold is breached or a condition is met, Grafana can send notifications via email, Slack, PagerDuty, or other messaging platforms.
Overall, Grafana is widely used in the field of DevOps and system monitoring to monitor infrastructure, applications, and services, providing real-time insights into the performance and health of systems. It is highly extensible and has a large community of contributors, which ensures continuous development and integration with various data sources and technologies.
Video to install Grafana on Linux:

Environment Specification:
We are using a minimal Rocky Linux 9 virtual machine with following specifications.
- CPU – 3.4 Ghz (2 cores)
- Memory – 2 GB
- Storage – 20 GB
- Operating System – Rocky Linux release 9.2 (Blue Onyx)
- Hostname – grafana-01.centlinux-com.preview-domain.com
- IP Address – 192.168.116.133/24
Prepare your Rocky Linux Server:
By using a ssh client, login on your Linux server as root user.
Set a fully qualified domain name (FQDN) for your Linux machine as follows.
# hostnamectl set-hostname grafana-01.centlinux-com.preview-domain.com
Update software packages in your Linux OS by using dnf command.
# dnf update -y
If the previous command updates your Linux Kernel, then you should reboot your machine with the newly installed Kernel.
# reboot
Note down the versions of Linux OS and Kernel that are being used in this tutorial.
# cat /etc/rocky-release
Rocky Linux release 9.2 (Blue Onyx)

# uname -r
5.14.0-284.11.1.el9_2.x86_64
Add Grafana Official Yum Repository:
You can download Grafana software from their official website and GitHub. But the preferred method for Red Hat Linux distros is to add their official yum repository and then install Grafana data visualization software by using dnf command.
Create a .repo file by using vim text editor.
# vi /etc/yum.repos.d/grafana.repo
Add following directives in this file.
[grafana]
name=grafana
baseurl=https://rpm.grafana.com
repo_gpgcheck=1
enabled=1
gpgcheck=1
gpgkey=https://rpm.grafana.com/gpg.key
sslverify=1
sslcacert=/etc/pki/tls/certs/ca-bundle.crt
exclude=*beta*
After adding Grafana repository, rebuild your yum cache.
# dnf makecache
grafana                                         183  B/s | 629  B     00:03
grafana                                         1.9 kB/s | 2.4 kB     00:01
Importing GPG key 0x2CF3C0C6:
 Userid     : "Grafana Labs <engineering@grafana.com>"
 Fingerprint: 0E22 EB88 E39E 1227 7A77 60AE 9E43 9B10 2CF3 C0C6
 From       : https://rpm.grafana.com/gpg.key
Is this ok [y/N]: y
grafana                                         825 kB/s |  33 MB     00:41
Rocky Linux 9 - BaseOS                          1.3 kB/s | 4.1 kB     00:03
Rocky Linux 9 - AppStream                       2.1 kB/s | 4.5 kB     00:02
Rocky Linux 9 - Extras                          1.3 kB/s | 2.9 kB     00:02
Metadata cache created.
Install Grafana on Linux Server:
Check the information about grafana software package.
# dnf info grafana.x86_64
Last metadata expiration check: 0:11:58 ago on Sun 21 May 2023 12:41:12 AM PKT.
Installed Packages
Name         : grafana
Version      : 9.5.2
Release      : 1
Architecture : x86_64
Size         : 273 M
Source       : grafana-9.5.2-1.src.rpm
Repository   : @System
From repo    : grafana
Summary      : Grafana
URL          : https://grafana.com
License      : AGPLv3
Description  : Grafana
Now, you can install Grafana on Linux by executing dnf command.
# dnf install -y grafana
In this Linux tutorial, we are installing Open-source edition of Grafana server. Alternatively, you can also install Grafana Enterprise edition by running following command.
# dnf install -y grafana-enterprise
Enable and start Grafana service.
# systemctl enable --now grafana-server
Synchronizing state of grafana-server.service with SysV service script with /usr/lib/systemd/systemd-sysv-install.
Executing: /usr/lib/systemd/systemd-sysv-install enable grafana-server
Created symlink /etc/systemd/system/multi-user.target.wants/grafana-server.service → /usr/lib/systemd/system/grafana-server.service.
Check the status of Grafana service for any possible errors.
# systemctl status grafana-server
● grafana-server.service - Grafana instance
     Loaded: loaded (/usr/lib/systemd/system/grafana-server.service; enabled; p>
     Active: active (running) since Sun 2023-05-21 00:28:43 PKT; 40s ago
       Docs: http://docs.grafana.org
   Main PID: 5695 (grafana)
      Tasks: 7 (limit: 23011)
     Memory: 66.2M
        CPU: 8.236s
     CGroup: /system.slice/grafana-server.service
             └─5695 /usr/share/grafana/bin/grafana server --config=/etc/grafana>

May 21 00:28:43 grafana-01.centlinux-com.preview-domain.com grafana[5695]: logger=modules t=2023-0>
May 21 00:28:43 grafana-01.centlinux-com.preview-domain.com systemd[1]: Started Grafana instance.
May 21 00:28:43 grafana-01.centlinux-com.preview-domain.com grafana[5695]: logger=grafanaStorageLo>
May 21 00:28:43 grafana-01.centlinux-com.preview-domain.com grafana[5695]: logger=http.server t=20>
May 21 00:28:43 grafana-01.centlinux-com.preview-domain.com grafana[5695]: logger=ngalert.state.ma>
May 21 00:28:43 grafana-01.centlinux-com.preview-domain.com grafana[5695]: logger=ngalert.state.ma>
May 21 00:28:43 grafana-01.centlinux-com.preview-domain.com grafana[5695]: logger=ticker t=2023-05>
May 21 00:28:43 grafana-01.centlinux-com.preview-domain.com grafana[5695]: logger=ngalert.multiorg>
May 21 00:28:43 grafana-01.centlinux-com.preview-domain.com grafana[5695]: logger=plugins.update.c>
May 21 00:28:43 grafana-01.centlinux-com.preview-domain.com grafana[5695]: logger=grafana.update.c>
To make your Grafana Dashboards accessible from Network, you need to allow the grafana service in Linux Firewall.
# firewall-cmd --permanent --add-service=grafana
success

# firewall-cmd --reload
success
Access Grafana Dashboards:
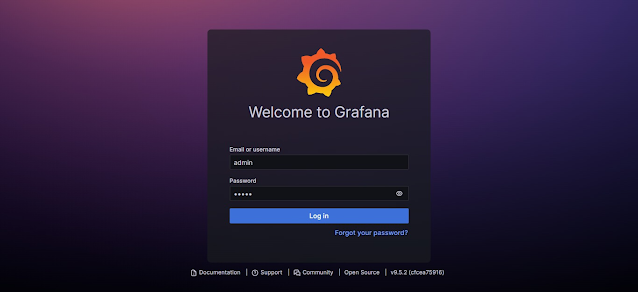
Open URL http://grafana-01.centlinux.com:3000 in a web browser.

Login to Grafana dashboards by using default username/password i.e. admin/admin

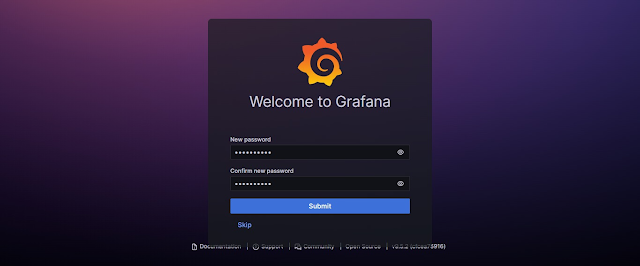
Set a new strong password for your Grafana admin user.

You have successfully login to Grafana web application.
Conclusion:
In this Linux tutorial, you have learned how to install Grafana on Linux 9. To start building some amazing dashboards, we suggest that you should attend online training Grafana Beginners to Advance Crash Course 2021


